
Roughly 70 million Americans hold digital assets in some form. Twenty-seven percent of likely voters own crypto, and 82% of those holders turn out. Call it the crypto voter: a bloc that barely existed a decade ago, built from traditional finance professionals, tech-savvy millennials, and mainstream investors.
None of this happened in isolation. Bitcoin and Ethereum ETF approvals, institutional adoption, and regulatory attention pushed crypto from the fringes of finance into American retirement accounts and investment portfolios. The more of the country’s savings that sits in digital assets, the more those assets show up in how people vote.
The obvious objection comes first. Owning an asset doesn’t make you a single-issue voter. Plenty of those 70 million hold crypto the way they hold an index fund, in an account they check twice a year. They’ll vote on rent and gas like everyone else. Even the friendliest survey in this piece only gets 58% of holders saying crypto policy will drive their vote.
So my claim is narrower than “crypto decides the election,” and I think it holds. This group votes at unusual rates, clusters in the states that decide the outcome, and now has a policy surface that reaches into its retirement statements. That’s enough to move margins, and margins are the whole game in November.
This piece is information-heavy by design, so I have used bullet points liberally while adding citations for you to DYOR.
Historical Context & Technological Precedent
The Clinton Era Internet
Technology and American politics have been colliding for a while. In 1992, Bill Clinton and Al Gore ran on the “Information Superhighway,” betting that an emerging technology would reshape the economy and, with it, the electorate. Their campaign was the first to make serious use of digital communications, setting up bulletin boards and email systems that look primitive today and were radical at the time.
Clinton’s administration followed with the Framework for Global Electronic Commerce (1997), and its principles still read like a modern policy memo:
- Private sector leadership
- Minimal government intervention
- Recognition of the Internet’s unique qualities
- Facilitation of global commerce [1]
Swap “Internet” for “blockchain” in those four lines and nobody at a Senate hearing would blink. Clinton’s people had to balance innovation against regulation, and today’s politicians face the same problem with a faster-moving technology. Many would argue that the current administration has a deferral-first and lawfare mentality.
The difference that matters is the order. The internet hit culture and communication first and the economy second. Crypto runs it backwards: the money moves first, and the social and cultural effects trail behind.
Evolution of Crypto Demographics
Financial Sector Overlap
Two groups that used to have little to say to each other now share a voter base: technology early adopters and financial services professionals. A trader and a dev in the same demographic make a bloc that bridges traditional finance and digital innovation.
The finance side is the better-documented half. It employs approximately 8.5 million Americans [2], and the profile looks like this:
- Professional demographics [3]:
- 73% hold college degrees (compared to 55% among crypto holders)
- Median age of 41 (overlapping with prime crypto adoption ages)
- 82% concentration in urban/suburban areas
- Estimated 1.88 million professionals actively engaged in both traditional finance and crypto markets [14]
- Geographic clustering in key financial centers showing strong crypto adoption [4]:
- Miami: 215,000 finance professionals, 120+ crypto companies
- Atlanta: 180,000 finance professionals, 85+ crypto companies
- Phoenix: 140,000 finance professionals, 65+ crypto companies
Look at those three cities again. Miami, Atlanta, and Phoenix sit in three of the four states this piece comes back to later, and finance professionals are the people everyone else asks about money. That’s a multiplier. But the devil is in the details, and we have to look a little deeper into this group’s voting pattern to understand them.
Voting Pattern Analysis [17]
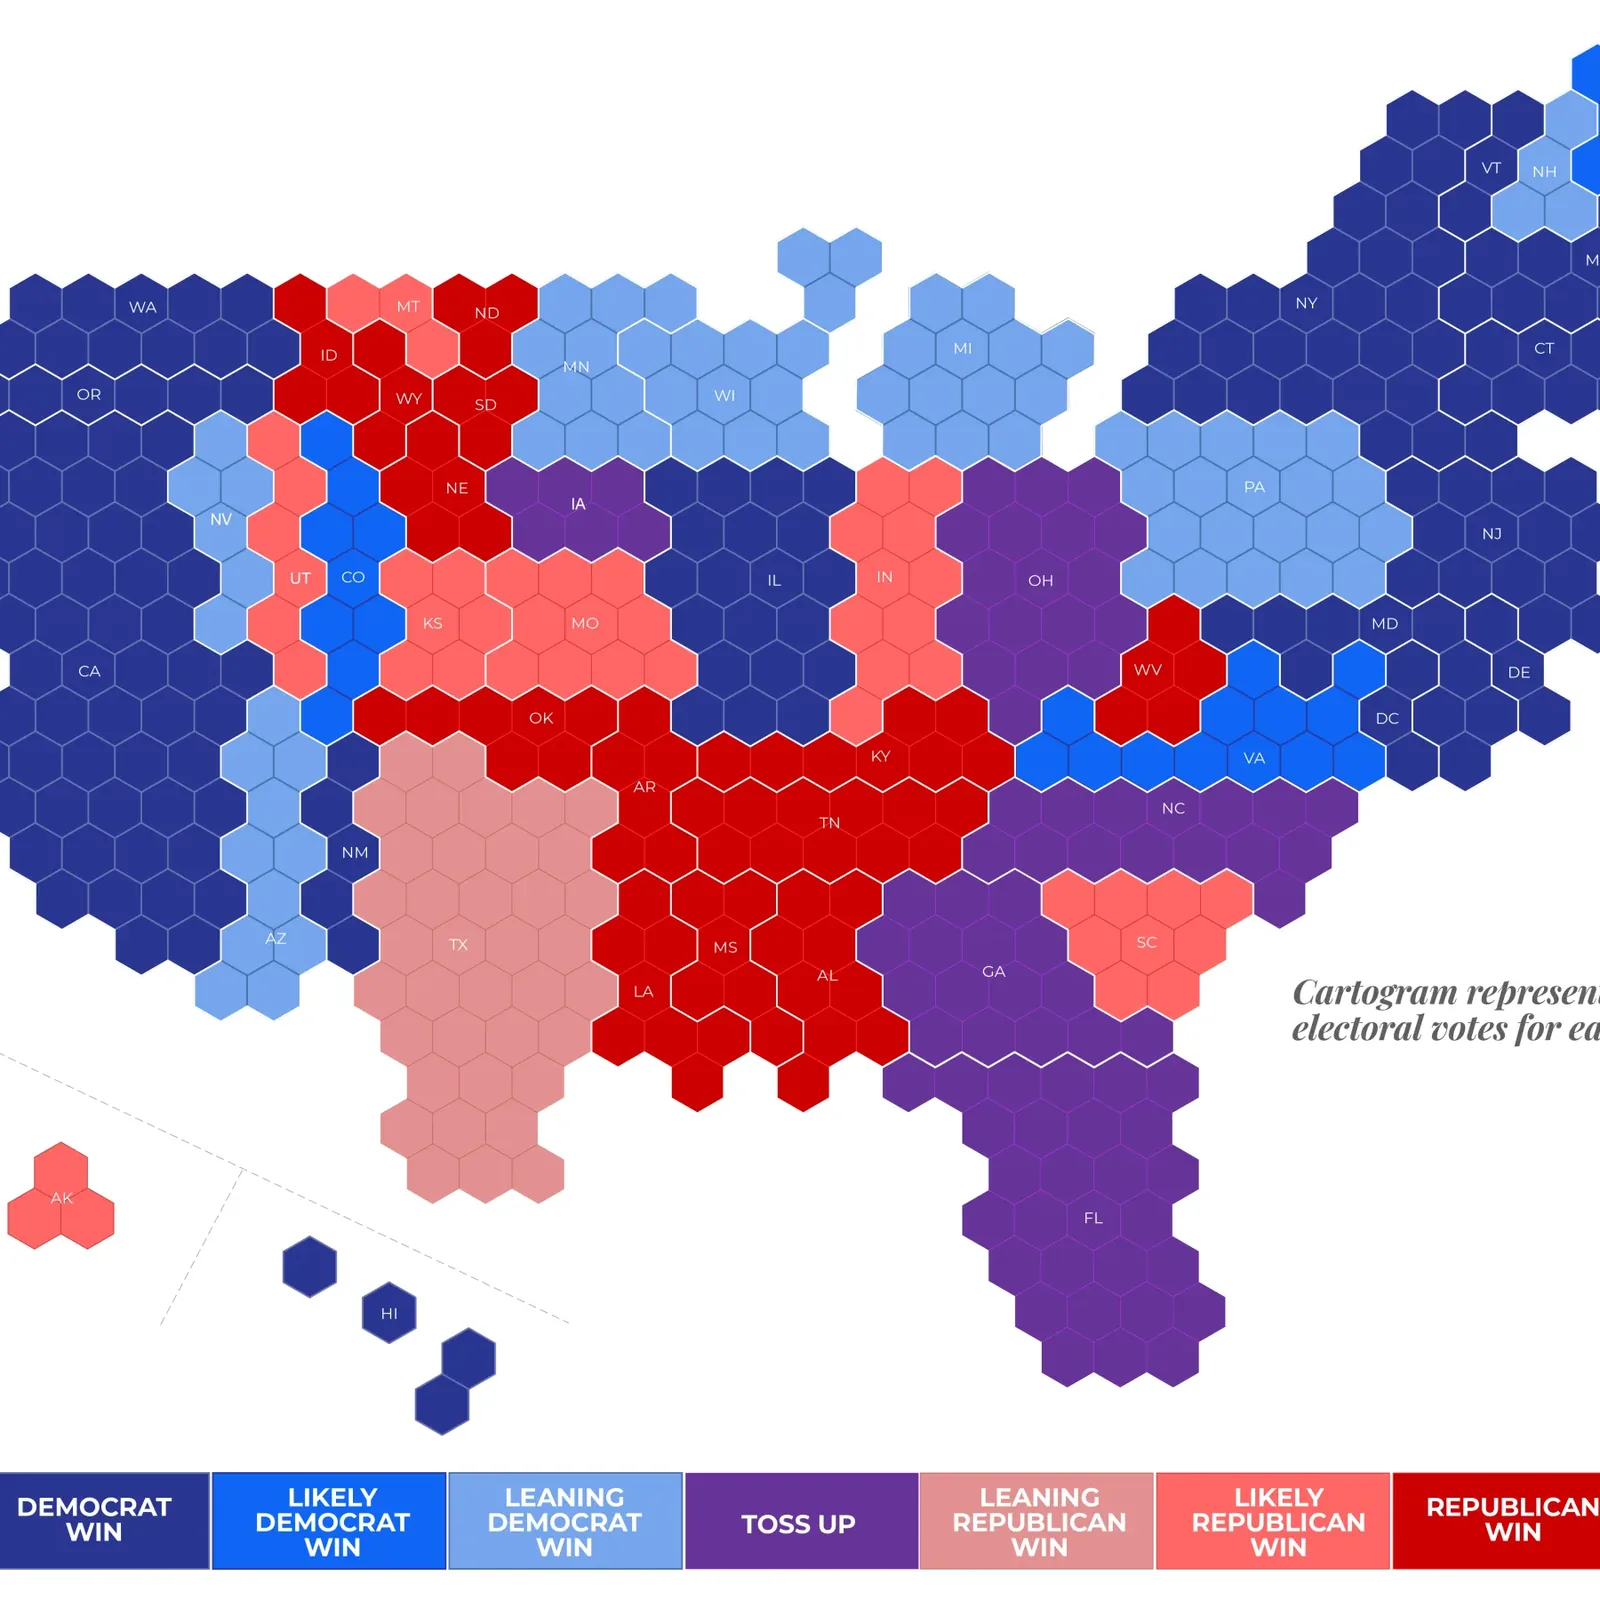
How does the finance crowd vote? Reliably, and on money. The historical pattern:
-
Issue prioritization [5]:
- Regulatory environment: 76% cite as their top concern
- Innovation policy: 62% consider crucial
-
Voting behavior [15]:
- Historically high turnout (averaging 85% in presidential elections)
- A strong tendency toward economic policy prioritization
- Track record of swing-voting based on financial policy positions
-
New convergence factors:
- Traditional finance professionals increasingly hold crypto positions
- Younger finance professionals (under 45) show a 58% crypto adoption rate
- Growing overlap between fintech and traditional finance career paths
Put those together and a new type of voter falls out: financially sophisticated, technologically adept, and paying close attention to policy outcomes. Combine the finance sector’s voting habits with crypto adoption rates and you get a constituency that:
- Is more likely to vote than the general population
- Shows higher sensitivity to regulatory and economic policy
- Maintains significant influence in professional networks
- Concentrates in politically crucial urban/suburban areas (aka population centers in swing states)
So what does a campaign chase here? The overlap. Finance professionals and crypto holders now share one policy surface, and the pressure comes from that shared surface rather than from either group on its own.
The ETF Watershed Moment
Finally… Market Integration
Bitcoin ETFs got approved and launched, and Ethereum followed more recently. That’s the biggest event in this piece, because the approvals changed the plumbing: crypto now reaches Americans through brokerage and retirement accounts instead of exchanges. Which puts it in front of people who would never open an exchange account.
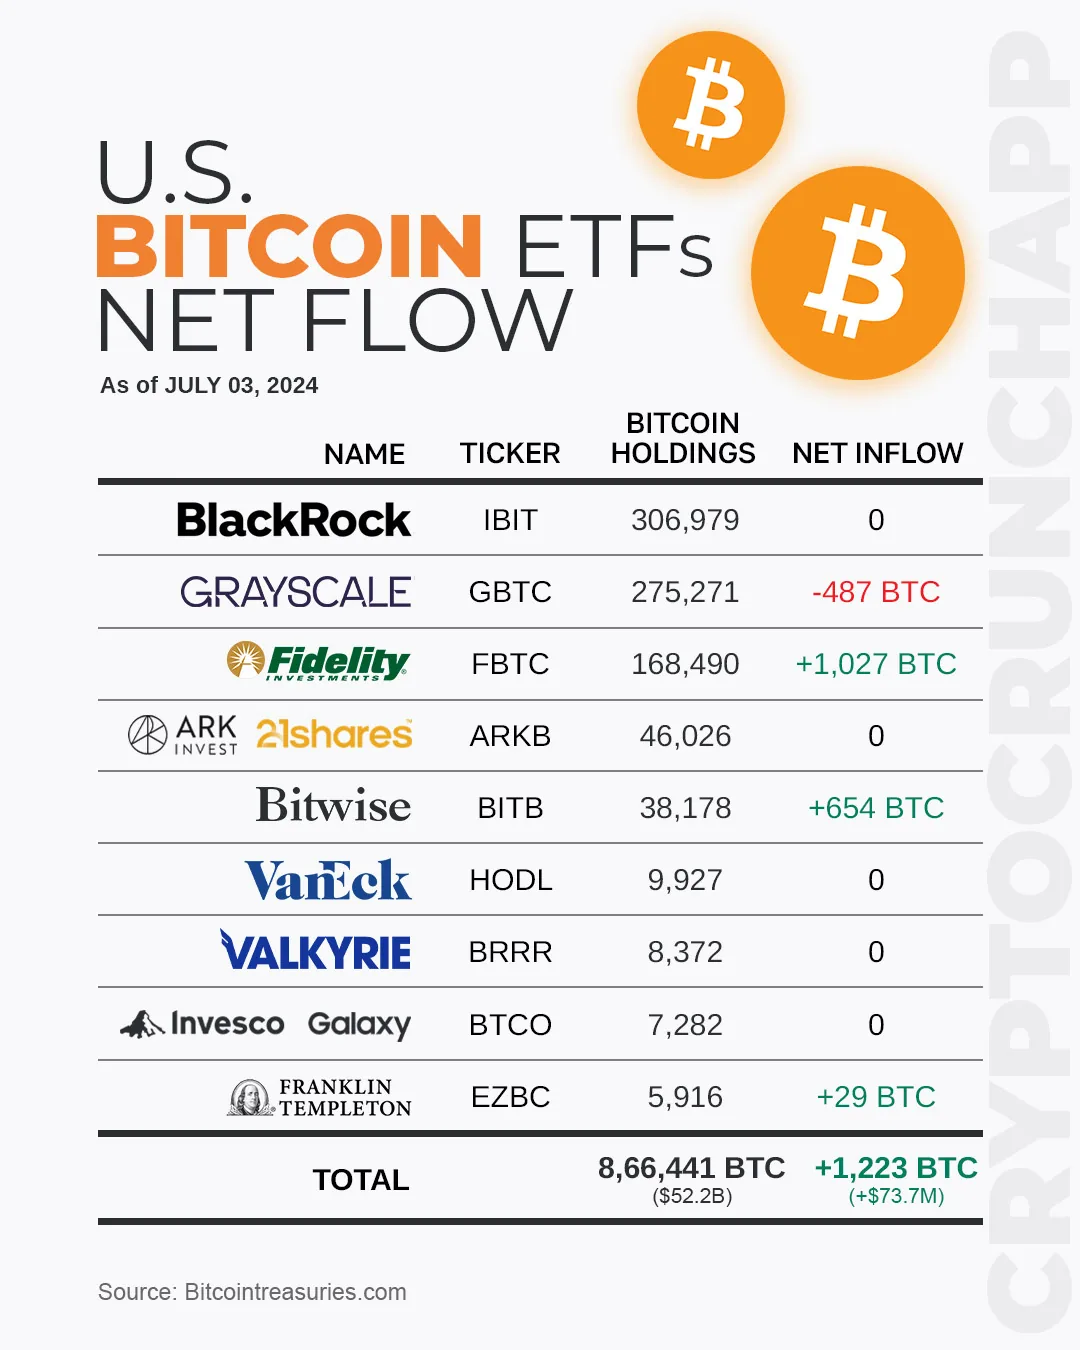
That’s the part that moves votes.
Institutional adoption is where the reach shows up, so that’s where I want to look.
- Traditional finance integration [6]:
- 65% of conventional institutions are developing crypto strategies
- Major banks incorporating digital asset services
- Wealth management firms (72%) actively developing crypto offerings
- Retirement account access [7]:
- Potential exposure to 15.8 million retirement accounts
- 12% of 401(k) providers exploring crypto options
- 18% of IRA providers offering crypto exposure
- Democratizing access across income levels
- General professional integration [8]:
- 22,000 financial professionals completed digital asset certifications in 2023
- 47% increase in crypto-related job postings across financial services
- Key growth areas:
- Digital asset risk assessment (38% of new certifications)
- Custody solutions (31% of new job postings)
- Trading desk integration (28% of positions)
Owning crypto stops being a personality trait once it’s a line item in a 401(k). So how does normal connect to the ballot?
Voter Behavior Connection

The ETF moment is a “threshold event” in voter behavior. A sort of Pragnanz-like effect, forcing us to create order from the crypto mess, and it shows up in a few places.
- The “ownership effect”:
- Historical precedent: 401(k) investors showing higher engagement in market-related policies
- Asset owners typically become more engaged in regulatory discussions
- Increased support for pro-market policies among retail investors
- Professional updates:
- Financial advisors becoming crypto-literate out of necessity
- Compliance professionals begin developing expertise
- IT sectors adapting to new infrastructure demands
- Key swing state impact:
- Financial centers developing crypto expertise
- Job creation in supporting industries
- Local government engagement with digital asset businesses
- Voter priority shifts we should see as crypto moves from speculative to mainstream:
- Regulatory clarity becoming a kitchen table issue
- Retirement security connecting to crypto policy
- Innovation policy gaining broader relevance
Proof the campaigns have noticed: the Bitcoin 2024 conference a few weeks ago put the top figures from crypto and finance on the lineup, along with two presidential candidates.
Candidates don’t show up to a Bitcoin conference for the coffee.
This demographic will influence the election, so what’s at stake economically?
The Stakes

Economic Implications
A voting bloc is the visible part. Underneath it sits a bigger question about America’s competitive position in global finance, and that one has numbers attached.
-
Job market transformation [9]:
- 210,000+ blockchain-related jobs created in the U.S. (2023)
- Average salary 32% higher than traditional finance positions
- 67% of positions are concentrated in swing-state metro areas
- Key growth sectors:
- Financial services integration (42%)
- Compliance and regulatory tech (28%)
- Infrastructure development (24%)
-
Tax base considerations [10]:
- Digital asset tax revenue potential: $11.4B annually
-
Regulatory clarity could unlock:
- $320B in trapped institutional capital
- $47B in potential state-level economic activity
- 15% increase in fintech startup formation
-
Global competitiveness metrics [11]:
- U.S. market share in global crypto transactions: 28%
- Institutional capital ready for deployment: $165B
- Key competitive pressures:
- Singapore: 18% market share gain (2022-2023)
- UAE: 12% market share gain
- Switzerland: 8% market share gain
One caveat on every figure above: they come from a “bear market,” what most would call the cyclical low point in the “typical” 4-year crypto cycle. In plain speak, this is a multi-year low point with expected multiples on return from this point. This demographic sees a yellow brick road and will vote accordingly to stay the path.
Voter Issues Matrix
The economics get this group in the door, and the priorities inside don’t sort neatly by party. This demographic consists mainly of moderates who vote on the current narrative and where they think the country is headed. What interests me is that the goals line up even where the party labels don’t.
- Primary voter concerns:
- Regulatory clarity: 84% cite as “very important”
- Investment protection: 76% prioritize
- Innovation support: 72% emphasize
- Data privacy: 68% consider crucial
- Cross-party appeal factors:
- Young conservative alignment:
- 73% support market-driven innovation
- 68% oppose excessive regulation
- 62% prioritize financial privacy
- Progressive tech adoption:
- 71% support financial inclusion initiatives
- 66% favor environmental considerations
- 58% emphasize consumer protection
- Young conservative alignment:
- Policy framework priorities (voter support for specific policy initiatives):
- Clear regulatory guidelines: 88%
- Innovation sandboxes: 76%
- Consumer protection frameworks: 72%
- International competitiveness measures: 68%
So what does this mean? Why does it matter, and why do we watch swing states?
Electoral Implications
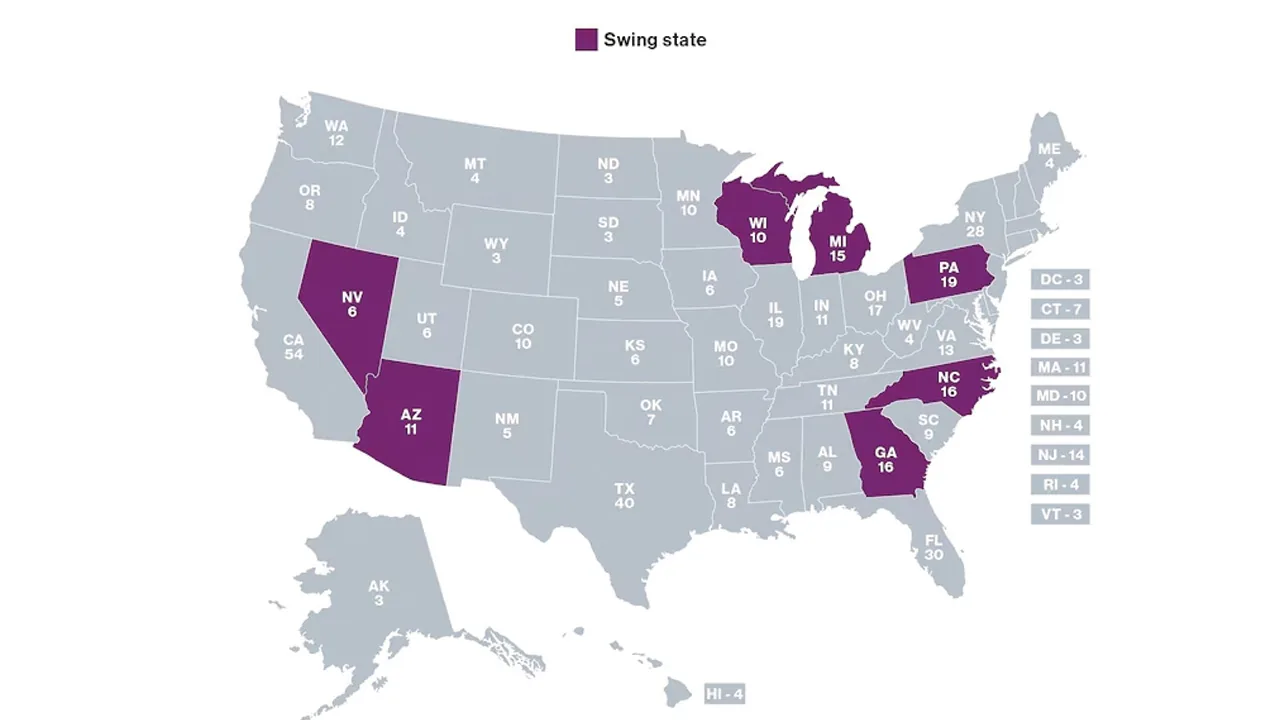
Map the jobs, the money, and the priorities together and the pressure points show themselves. Two of the three candidates strongly support crypto, as I mentioned above, so what do they see that the rest of the field doesn’t?
- Swing state impact (tech hub concentration in key electoral districts):
- Georgia: 145,000 fintech/crypto jobs
- Arizona: 98,000 related positions
- Nevada: 72,000 industry employees
- Demographic voting power:
- 27% crypto ownership among likely voters
- 82% voter participation rate among holders
- 44% identify as “swing voters” on economic issues
State-by-State Impact Analysis
Four states carry most of the weight, and this is where crypto adoption and electoral demographics land on the same map for the 2024 cycle.
-
Florida: The Emerging Crypto Hub [12]
- Total crypto/fintech employment: 360,000
- Regional distribution:
- Miami-Dade: 145,000 jobs (40.3%)
- Tampa Bay: 89,000 jobs (24.7%)
- Orlando: 72,000 jobs (20%)
- Jacksonville: 54,000 jobs (15%)
- Industry presence:
- 385 registered crypto companies
- $8.2B monthly trading volume
- 34% year-over-year job growth
- Electoral significance:
- 1,250 new crypto-related business registrations (2023)
- 72% of crypto employees are registered voters
- 28% increase in industry PAC contributions
-
Georgia: The NYC of the South
- Total industry employment: 145,000
- Key metrics:
- Atlanta metro: 115,000 jobs
- 58% voter registration rate among employees
- 44% identify as swing voters
-
Arizona: Emerging Tech Center
- Total related positions: 98,000
- Distribution:
- Phoenix: 75,000 jobs
- Tucson: 23,000 jobs
- 66% voter participation rate
- 41% of first-time industry voters
-
Nevada: Digital Finance Hub
- Industry employment: 72,000
- Concentration:
- Las Vegas: 45,000 jobs
- Reno: 27,000 jobs
- 63% likely voter rate
- 38% independent voters
Georgia and Nevada are the two I’d circle: 44% swing voters in one and 38% independents in the other is a lot of persuadable people in states decided at the margin.
Demographic Voting Power: Refined Analysis
Now zoom out from the states to the holders themselves.
- Voter registration patterns:
- Overall crypto holder registration: 27% of likely voters
- Registration by age group:
- 18-29: 68% registration rate
- 30-44: 74% registration rate
- 45-60: 81% registration rate
- 60+: 85% registration rate
- Voting behavior metrics (participation rates):
- 82% overall voter turnout among holders
- 44% swing voter identification
- 36% of first-time voters in 2020
- 58% plan to vote based on crypto policy
- Income and education correlation:
- Voting preference by income:
- $100k: 76% participation rate
- $50k-$100k: 68% participation rate
- Under $50k: 54% participation rate
- Education level impact:
- Graduate degree: 84% participation
- Bachelor’s degree: 78% participation
- Some college: 65% participation
- Voting preference by income:
The age curve is the one I keep coming back to. Registration climbs from 68% under 30 to 85% over 60, so the crypto voter as a twenty-something who forgets to register doesn’t survive contact with the table.
Policy Influence Patterns
And the block any campaign treating this as a fringe issue should print out:
- Priority issues among crypto voters:
- Regulatory framework: 84% crucial
- Economic innovation: 76% important
- Job creation: 72% significant
- International competitiveness: 68% relevant
- Voting pattern shifts [13]:
- 38% changed party affiliation based on crypto stance
- 45% would cross party lines for pro-crypto candidates
- 52% consider crypto policy a “top 3” voting issue
Conclusion
Clinton’s team wired up bulletin boards and called it a superhighway. Three decades later the same fight runs through 401(k) statements, and 52% of these voters rank crypto policy a top-three issue. Approximately 70 million Americans now hold digital assets in some form [16], and in the four states above that’s enough weight to tip a close count.
The interest group grew into an electorate while nobody was counting.
The Clinton parallel holds right up to the point where it breaks. The superhighway changed how America talked and shopped in the 1990s before it changed what anyone earned. Digital assets hit portfolios and retirement accounts on day one, and voters feel a portfolio faster than a culture shift.
So, for the next three months, watch Florida, Georgia, Arizona, and Nevada, and watch which candidate says “regulatory clarity” without being asked. The parties that take this demographic seriously pick up an edge in tightly contested states. The ones that file it under fringe find out on election night how many of their voters have a wallet.
DYOR, and then go vote.
Sources
- Clinton Presidential Library. (1997). “Framework for Global Electronic Commerce.”
- U.S. Bureau of Labor Statistics. (2023). “Financial Activities: Employment Statistics.”
- FINRA Foundation. (2023). “The State of U.S. Financial Professional Credentials.”
- U.S. Census Bureau. (2023). “Metropolitan Statistical Areas: Financial Employment.”
- Morgan Stanley. (2023). “Financial Sector Voting Patterns.”
- Deloitte. (2023). “Global Blockchain Survey.”
- Federal Reserve Bank. (2023). “Survey of Consumer Finances.”
- CFA Institute. (2023). “Investment Professional of the Future.”
- LinkedIn Economic Graph. (2023). “Digital Asset Job Market Analysis.”
- PwC Financial Services. (2023). “Crypto Assets: The Institutional Perspective.”
- Florida Department of Economic Opportunity. (2023). “Digital Finance Industry Report.”
- Gallup Poll. (2023). “Digital Asset Policy and Voter Preferences.”
- Pew Research Center. (2023). “Demographics of Digital Asset Ownership.”
- Galaxy Digital Research. (2023). “Institutional Adoption of Digital Assets”
- Pew Research Center. (2023). “Financial Sector Political Engagement Study”
- Gemini. (2023). “Global State of Crypto Report”
- Harvard Kennedy School. (2023). “Digital Assets and Voter Demographics”
- Brookings Institution. (2023). “Cryptocurrency Adoption and Voter Behavior”
- American Enterprise Institute. (2023). “Digital Asset Policy Survey”